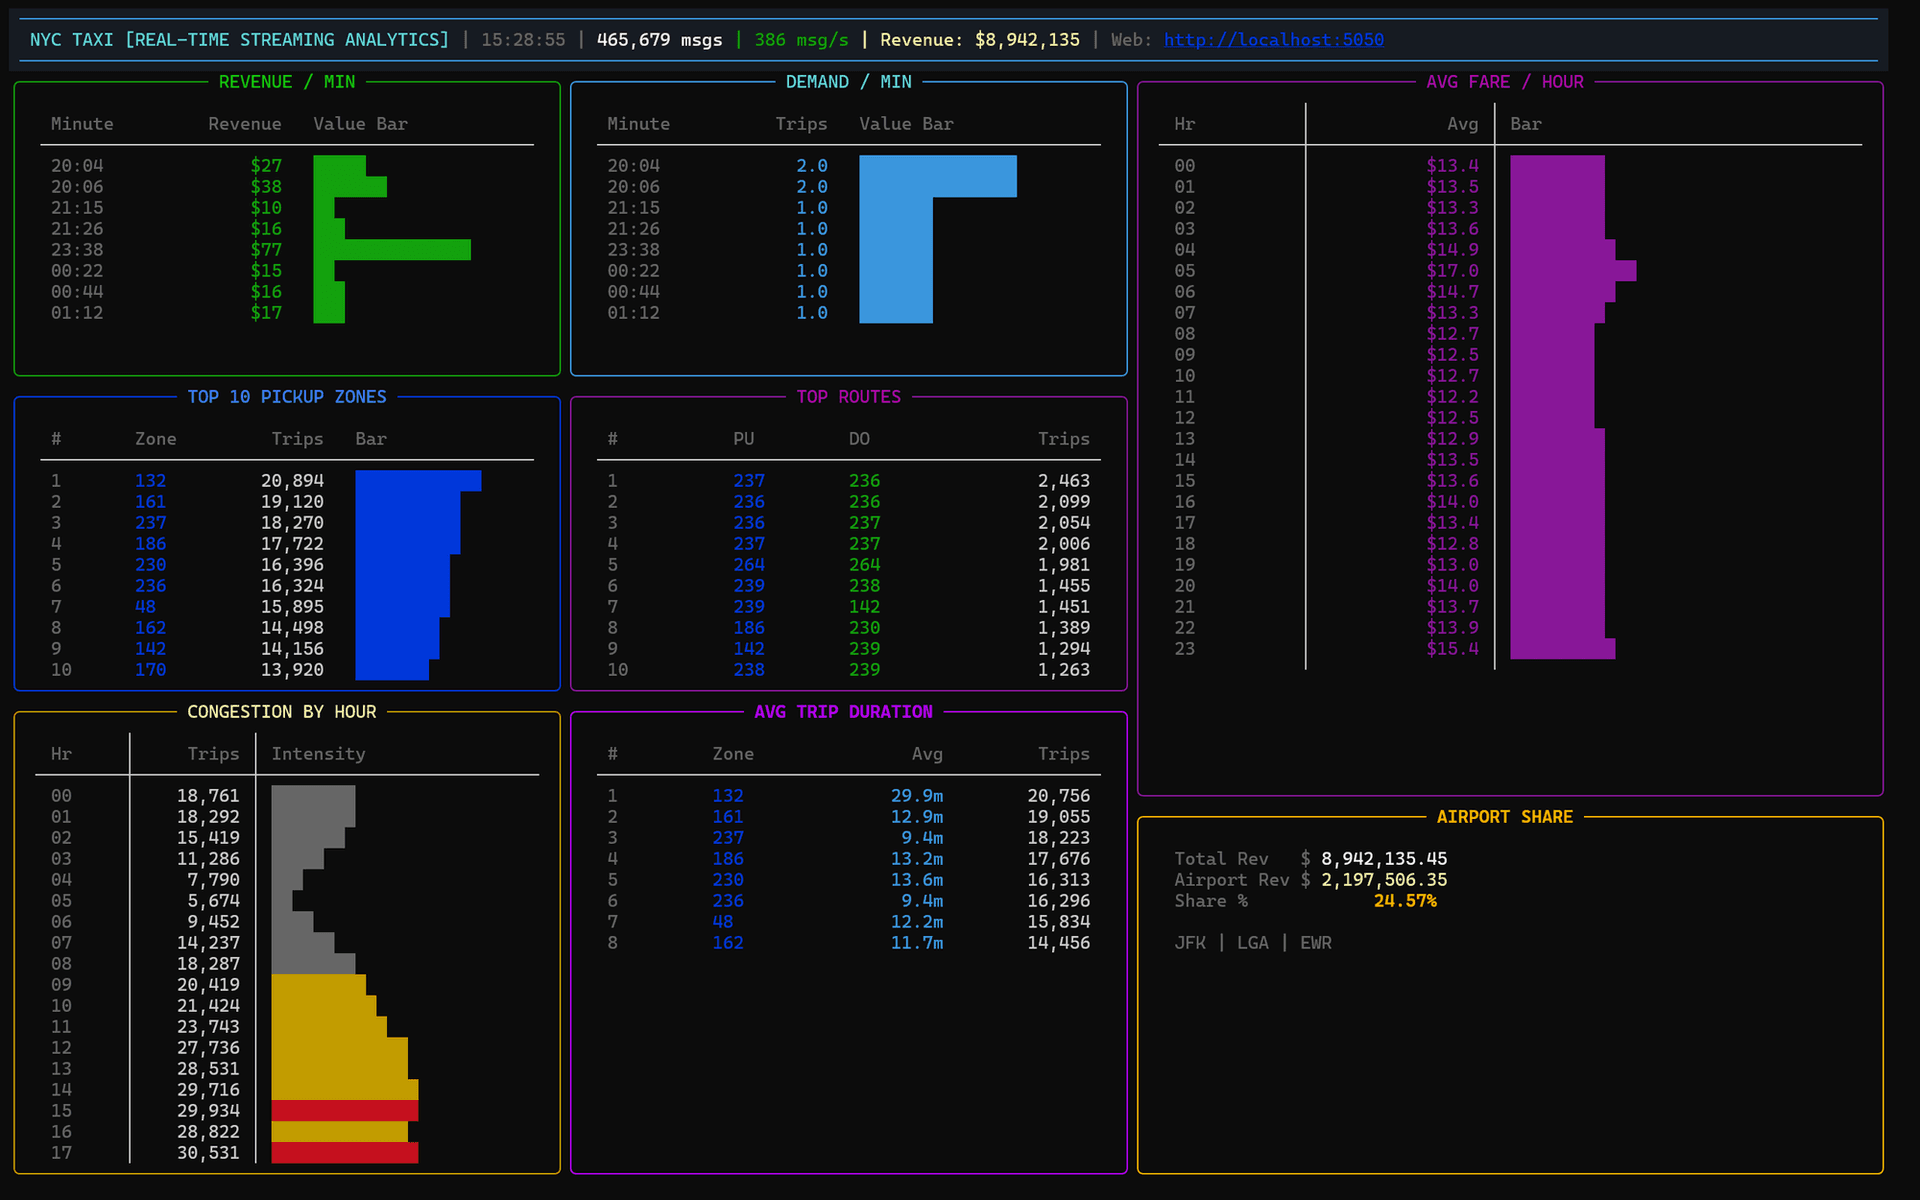
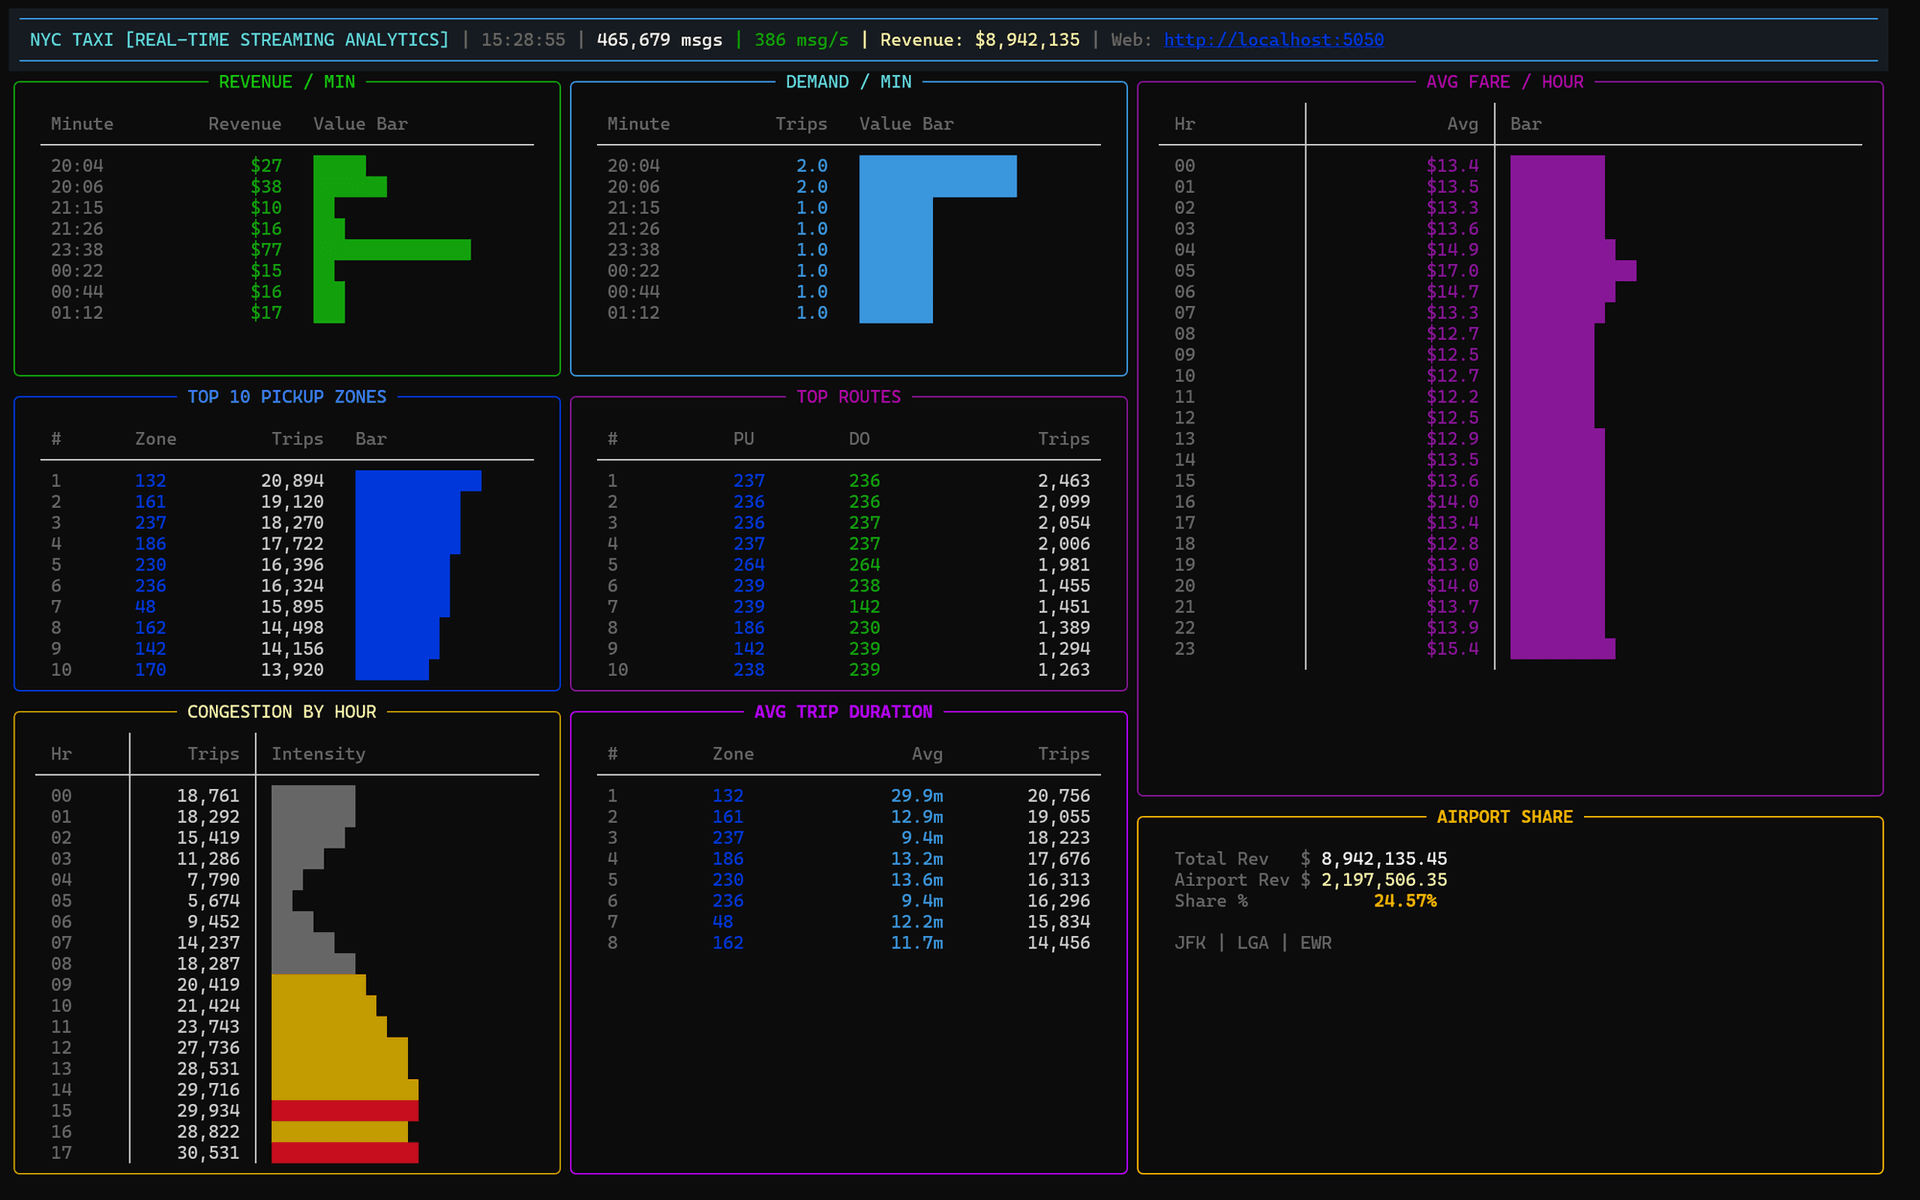
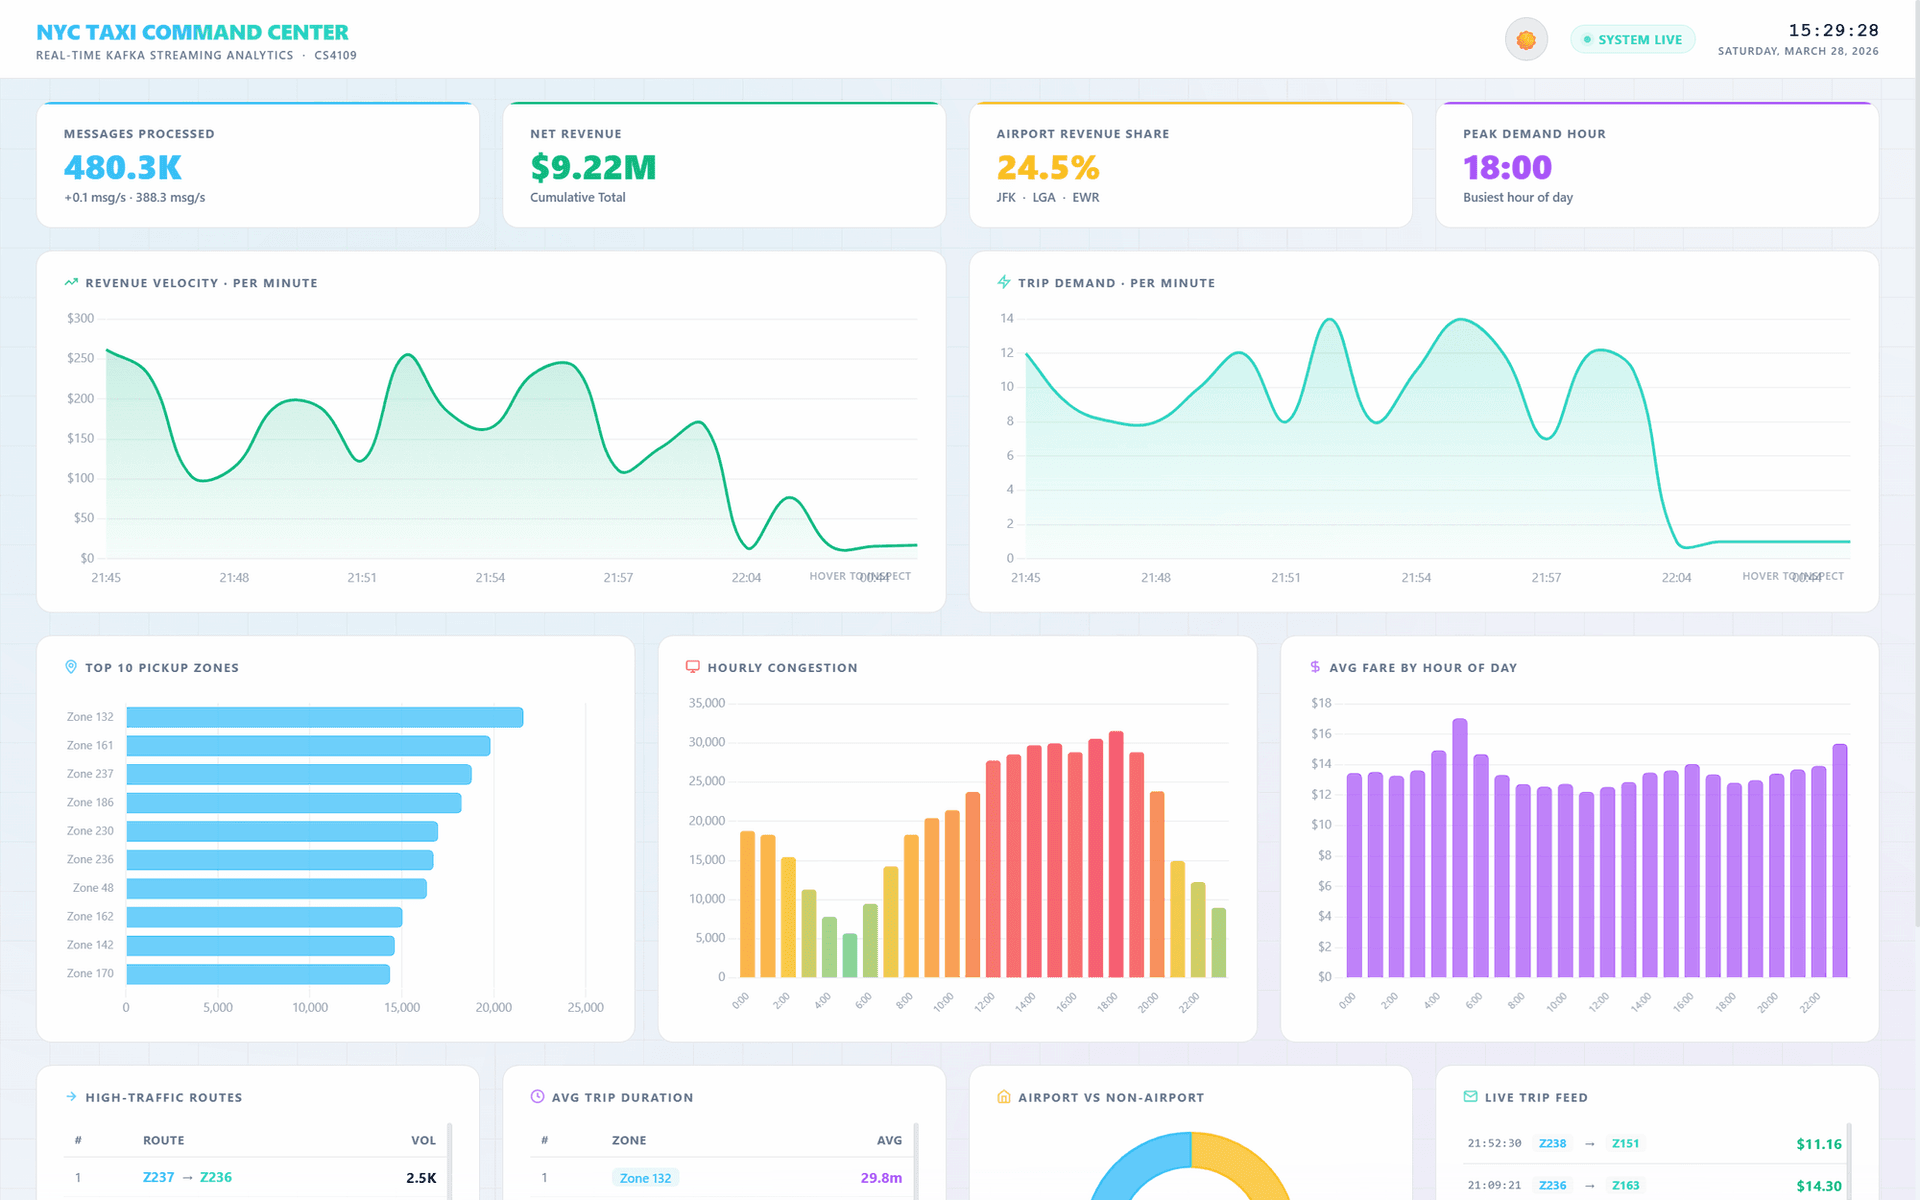
Kafka streaming pipeline over NYC Yellow Taxi trip records, computing eight live analytics at 1000+ messages per second and surfacing them through both a terminal UI and a web dashboard.
Taxi operations questions are time-sensitive: where demand is spiking now, which hours congest, what airports are contributing. Batch answers arrive too late to act on.
Producer reading Parquet, validating and publishing to a four-partition Kafka topic with 24-hour retention
Stateful consumer computing revenue per minute, top pickup zones, demand, fare by hour, airport share, congestion by hour, top routes and duration by zone
Dual dashboards: a Rich terminal UI and a Flask plus Chart.js web dashboard with light and dark themes
Validation layer dropping malformed rows before they can corrupt aggregates
Kafka and ZooKeeper orchestrated with Docker Compose, plus a single-command launcher
Challenges & learnings
Trip duration needed bounding to 0 to 7200 seconds, because the raw data contains dropoffs before pickups and rides that never ended.
Partitioning the topic four ways allows parallel consumption but means per-partition offsets have to be reasoned about when resetting a run.
Producer throughput trades against realism: a zero delay maximises ingest rate but stops resembling a live stream.
Visuals & outputs
Rich terminal dashboard showing the eight live analytics